
Page 17 - Echoes of the Global South V2
P. 17
economic resilience, growth potential, and integration into the global economy. Countries with diversified economies are
better positioned to withstand external shocks, while those reliant on a single sector or commodity are more vulnerable
to global price fluctuations and demand changes.
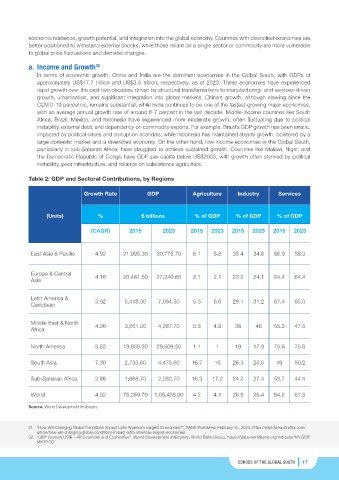
a. Income and Growth
32
In terms of economic growth, China and India are the dominant economies in the Global South, with GDPs of
approximately US$17.7 trillion and US$3.5 trillion, respectively, as of 2023. These economies have experienced
rapid growth over the past two decades, driven by structural transformations to manufacturing- and services-driven
growth, urbanisation, and significant integration into global markets. China’s growth, although slowing since the
COVID-19 pandemic, remains substantial, while India continues to be one of the fastest-growing major economies,
with an average annual growth rate of around 6-7 percent in the last decade. Middle-income countries like South
Africa, Brazil, Mexico, and Indonesia have experienced more moderate growth, often fluctuating due to political
instability, external debt, and dependency on commodity exports. For example, Brazil’s GDP growth has been erratic,
impacted by political crises and corruption scandals, while Indonesia has maintained steady growth, bolstered by a
large domestic market and a diversified economy. On the other hand, low-income economies in the Global South,
particularly in sub-Saharan Africa, have struggled to achieve sustained growth. Countries like Malawi, Niger, and
the Democratic Republic of Congo have GDP per capita below US$2000, with growth often stymied by political
instability, poor infrastructure, and reliance on subsistence agriculture.
Table 2: GDP and Sectoral Contributions, by Regions
Growth Rate GDP Agriculture Industry Services
(Units) % $ billions % of GDP % of GDP % of GDP
(CAGR) 2015 2023 2015 2023 2015 2023 2015 2023
East Asia & Pacific 4.92 21,995.30 30,775.70 6.1 5.8 35.4 34.6 56.9 58.3
Europe & Central 4.16 20,481.50 27,240.60 2.1 2.1 23.2 24.1 64.4 64.4
Asia
Latin America & 3.92 5,418.30 7,094.30 5.3 6.6 29.1 31.2 67.4 65.3
Caribbean
Middle East & North 4.26 3,201.00 4,287.70 5.3 4.9 38 46 55.2 47.5
Africa
North America 5.82 19,858.20 29,509.30 1.1 1 19 17.9 75.6 75.6
South Asia 7.30 2,733.60 4,475.60 16.7 16 26.3 25.5 49 50.2
Sub-Saharan Africa 2.86 1,668.70 2,032.70 16.3 17.2 24.2 27.4 53.7 44.4
World 4.92 75,359.70 1,05,435.00 4.2 4.1 26.8 26.4 64.2 61.8
Source: World Development Indicators
31. “How Will Changing Global Conditions Impact Latin America’s Largest Economies?”, RANE Worldview, February 05, 2024, https://worldview.stratfor.com/
article/how-will-changing-global-conditions-impact-latin-americas-largest-economies
32. “GDP (current US$) – All Countries and Economies”, World Development Indicators, World Bank Group, https://data.worldbank.org/indicator/NY.GDP.
MKTP.CD
16 ECHOES OF THE GLOBAL SOUTH ECHOES OF THE GLOBAL SOUTH 17