
Page 11 - Food Inflation in Southeast Asia 2
P. 11
1. January 2001 - October 2001 (10 consecutive months)
2. February 2003 - March 2003
3. May 2003 - June 2003
4. November 2003 - January 2004
5. March 2004 - May 2006 (27 consecutive months)
6. July 2006 - August 2006
7. October 2006 - November 2006
8. January 2007 - December 2009 (36 consecutive months)
9. July 2013
10. January 2014 - March 2014
11. September 2014 - November 2014
12. February 2015 - April 2016 (15 consecutive months)
13. January 2017 - September 2018 (21 consecutive months)
14. December 2018
15. March 2019
16. June 2019
17. April 2020 - April 2021 (13 consecutive months)
18. July 2021 - November 2021
19. April 2022 - December 2023 (21 consecutive months)
For most months during the last 23 years, Brunei experienced a higher inflation rate in CFPI vis-à-vis CPI.
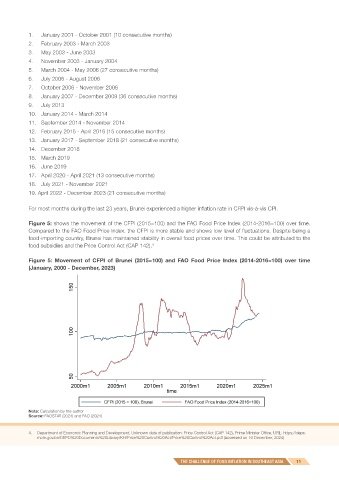
Figure 5: shows the movement of the CFPI (2015=100) and the FAO Food Price Index (2014-2016=100) over time.
Compared to the FAO Food Price Index, the CFPI is more stable and shows low level of fluctuations. Despite being a
food-importing country, Brunei has maintained stability in overall food prices over time. This could be attributed to the
food subsidies and the Price Control Act (CAP 142). 4
Figure 5: Movement of CFPI of Brunei (2015=100) and FAO Food Price Index (2014-2016=100) over time
(January, 2000 - December, 2023)
Note: Calculation by the author
Source: FAOSTAT (2024) and FAO (2024)
4. Department of Economic Planning and Development, Unknown data of publication: Price Control Act (CAP 142), Prime Minister Office, URL: https://deps.
mofe.gov.bn/DEPD%20Documents%20Library/KH/Price%20Control%20Act/Price%20Control%20Act.pdf (accessed on 16 December, 2024)
THE CHALLENGE OF FOOD INFLATION IN SOUTHEAST ASIA 11